時間
30×カバレッジで典型的な全ヒトゲノムを処理するためには、さまざまな計算処理プラットフォームを採用できます。一部のアプリケーションでは、迅速な二次解析が求められ、より短時間で結果を得ることが重要になります。また別のアプリケーションでは、生成されるデータ量が膨大であるために、迅速な二次解析が有益となる場合があります。NovaSeq Xに組み込まれた二次解析は、こうした需要に十分対応できる能力を備えています。
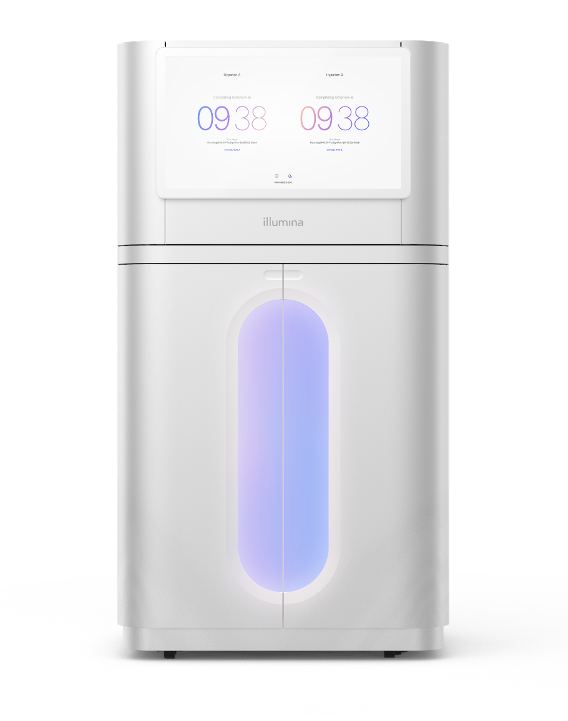
NovaSeq Xは、デュアルフローセルランあたり最大128以上の30×全ゲノムシーケンス(WGS)サンプルを生成する、真にファクトリー規模の装置です。NovaSeq Xの洗練されたシェルに密かに収納されたDRAGENは、二次解析をその場で実行することができ、次のランのセットアップに必要な時間(つまり、洗浄とクラスター化の時間)だけで、最後のランのデータを処理してしまうこともしばしばです。
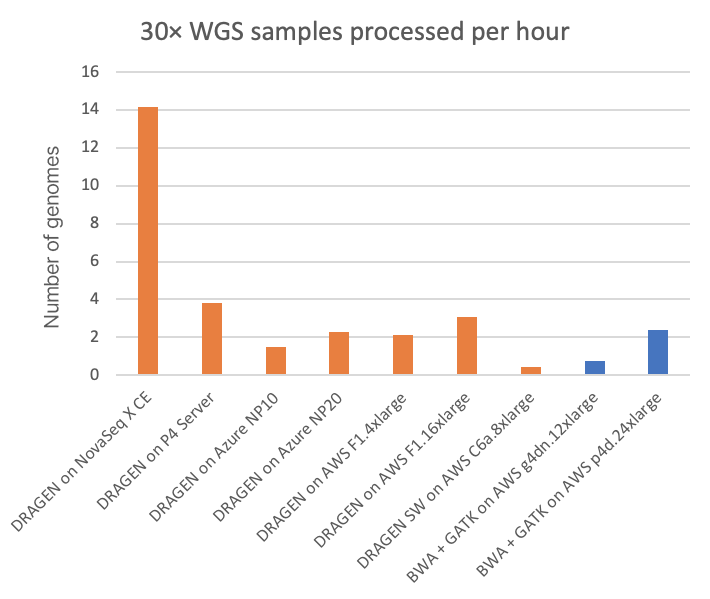
NovaSeq X Plusでは、デュアルソケットAMD EPYC 7552(96 x86_64コアの組み合わせ)で装置上のDRAGENによる処理が実行されます。このデュアルソケットは、4枚のXilinx Alveo U250 FPGAカードと1.5 TBのRAMも備えています。この強力な演算処理能力により、装置上のDRAGENは、gVCFへの完全処理済み出力(各サンプルのBCLからのソート/重複排除、リードのアラインメント、バリアントコール)を行い、30× WGSサンプルを約4分ごとに処理することが可能です。図2では、他のDRAGEN実装、およびGPUで高速化された一部のサードパーティパイプラインとこの速度を比較しました。
図2では、NovaSeq Xに搭載されたFPGAアクセラレーション対応のDRAGENが、T4 GPUクラウドインスタンスと比較して約20倍、A100 GPUクラウドインスタンスと比較して約6倍の高速処理を実現していることが示されています。
以下のチャートにおいて、次の点に留意してください。
- “DRAGEN on NovaSeq X CE”は、NovaSeq X装置の一部である、組み込み型の装置内HPCコンピューティングシステムです。
- “DRAGEN on P4 Server”は、イルミナから購入できるオンサイト専用のDRAGEN サーバーの最新バージョンです。
- その他のすべてのメトリクスは、Microsoft AzureおよびAmazon Web Services(AWS)から公開されているさまざまな種類のクラウドコンピューティングインスタンスでの実行から導き出されます。
- DRAGENパイプラインのソフトウェア専用バージョンを使用する“DRAGEN SW on AWS C6a.8xlarge”に関連するものを除き、すべてのDRAGENランにはFPGAアクセラレーションが含まれています。
- BWA + GATKランは、AWSクラウド内の2つの異なるタイプのGPUインスタンスタイプについて示しています。ここでは、パイプラインが高速ランタイムのためにGPUに移植され、最適化されています。
コスト
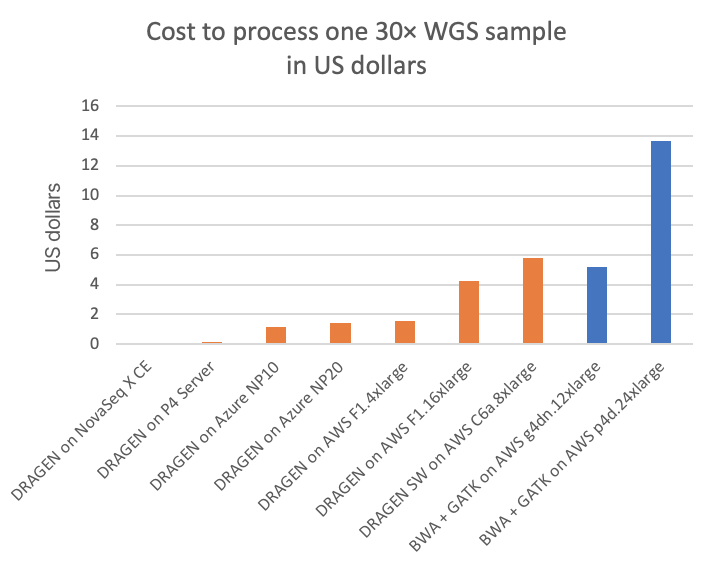
大量のデータを処理する場合、計算処理コストも考慮する必要があります。NovaSeq X装置では、DRAGEN計算処理は装置コストの一部として含まれているため、NovaSeq Xユーザーにとっては実質的に無料です。しかし、シーケンススループットに対するコンピューティングコンポーネントのコストを考えると、装置の予想寿命5年で償却した場合に30× WGSサンプルあたりのコストを計算できます。
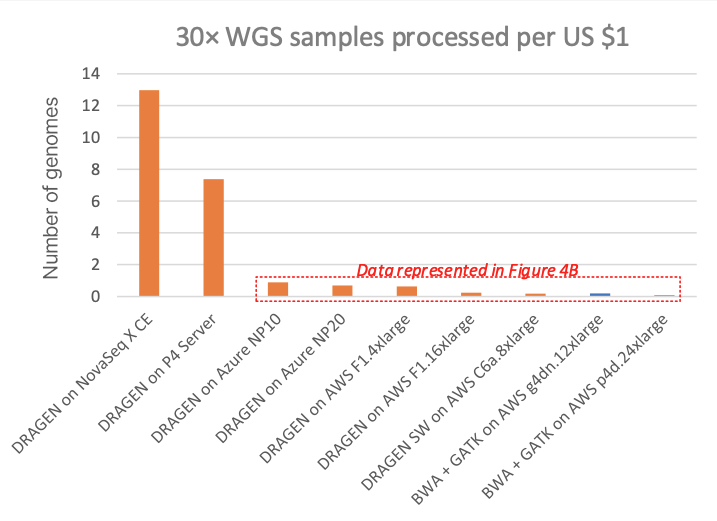
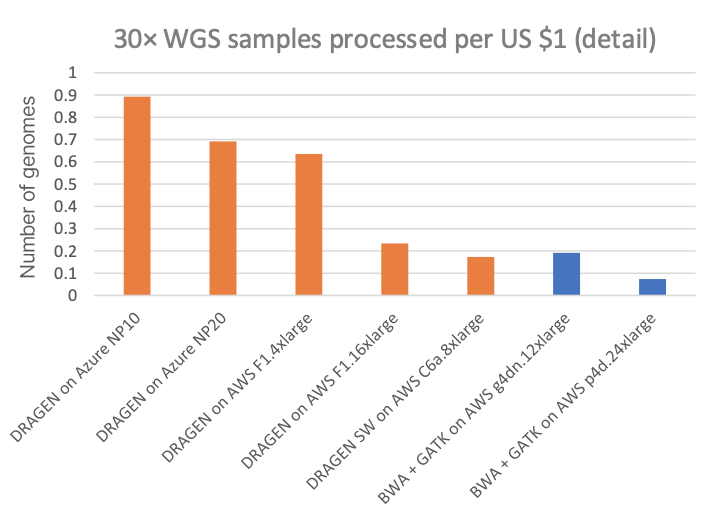
図3は、30× WGSサンプルあたりのコストで、さまざまなクラウドコンピューティングインスタンス上の他のDRAGENパイプラインやサードパーティパイプライン(すべてのクラウドリストに表示されたオンデマンド価格)と比較しています。図4Aは、1ドルあたりの処理可能な30× WGSサンプル数を示し、サブプロットの図4Bは、専用のDRAGENハードウェアデータポイントを取り除いた図4Aの詳細図を示しています(NovaSeq X CEおよびDRAGEN P4 Serverの1ドルあたりのサンプル数は非常に多いため、クラウドオプションの価格設定の微妙な差異を表示するにはy軸スケールの拡大が必要です)。
チャートでは、FPGAアクセラレーション対応DRAGEN内蔵NovaSeq Xは、T4またはA100 GPUのクラウドインスタンスと比較して、それぞれ最大60倍または170倍以上のコスト優位性があることが示されています。
エネルギー
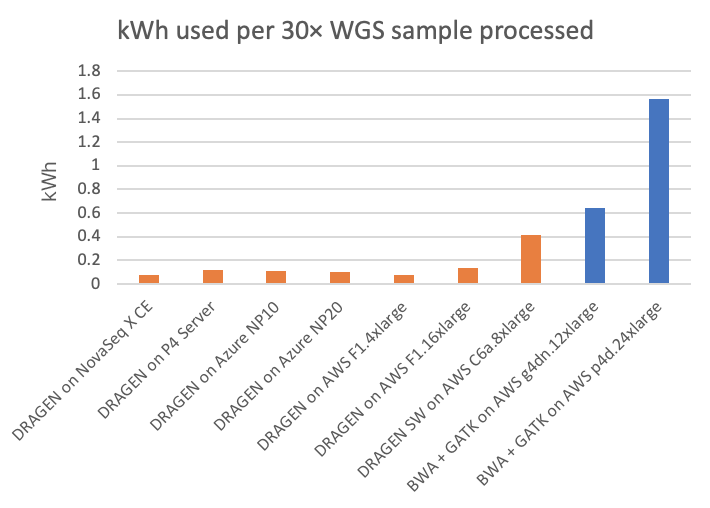
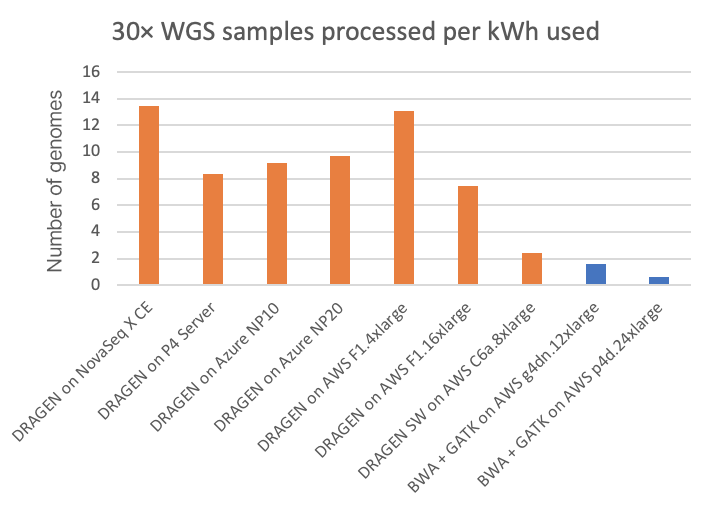
電力消費は、環境への影響やユーティリティコストに関連するだけでなく、電力が二次解析計算処理プラットフォームのフォームファクターを制限する可能性があるため、重要な要因です。NovaSeq X CEおよびP4 Server DRAGENのランでは、DRAGEN計算処理プラットフォームからの消費電力を直接測定できます。クラウドプラットフォームでは、掲載されたシステム構成に基づいて消費電力を推定しています。(読者の皆様:クラウドの消費電力に関するより正確な情報をお持ちの場合は、こちらのリンク先のフォームからお知らせ頂けると幸甚です。本稿を適宜修正いたします。) エネルギー使用量は、30× WGSサンプルあたりのキロワット時とその逆(30× WGS/kWh)の両方を図5と図6にそれぞれ示しています。これは、装置上のNovaSeq X DRAGENと、オンサイトのP4 DRAGEN サーバー、およびクラウドコンピューティングインスタンス上で実行されるその他のDRAGENパイプラインとサードパーティパイプラインについて報告しています。
チャートでは、FPGAアクセラレーション対応DRAGEN内蔵NovaSeq Xは、T4またはA100 GPUのクラウドインスタンスと比較して、それぞれ最大8倍または20倍以上のコスト優位性があることが示されています。
設置面積
特に、NovaSeq X装置には1つの標準規格(200~240ボルトAC、50/60ヘルツ、15アンペア、単相電源プラグ)しかありません。そこからシーケンスハードウェア(レーザー、ヒーター、ポンプなど)とDRAGENコンピューティングの両方が電力を消費することになります。さらに、内蔵されたDRAGENのコンピューティングから生成される熱は、シーケンス自体に化学的および生物学的悪影響を及ぼさない程度に除去できなくてはなりません。FPGAアクセラレーション対応DRAGENは、ゲノムあたりのエネルギー消費量が少なく、コンパクトなHPCクラスのコンピューティングにより、この合理化された設置面積を実現します。
結果の品質
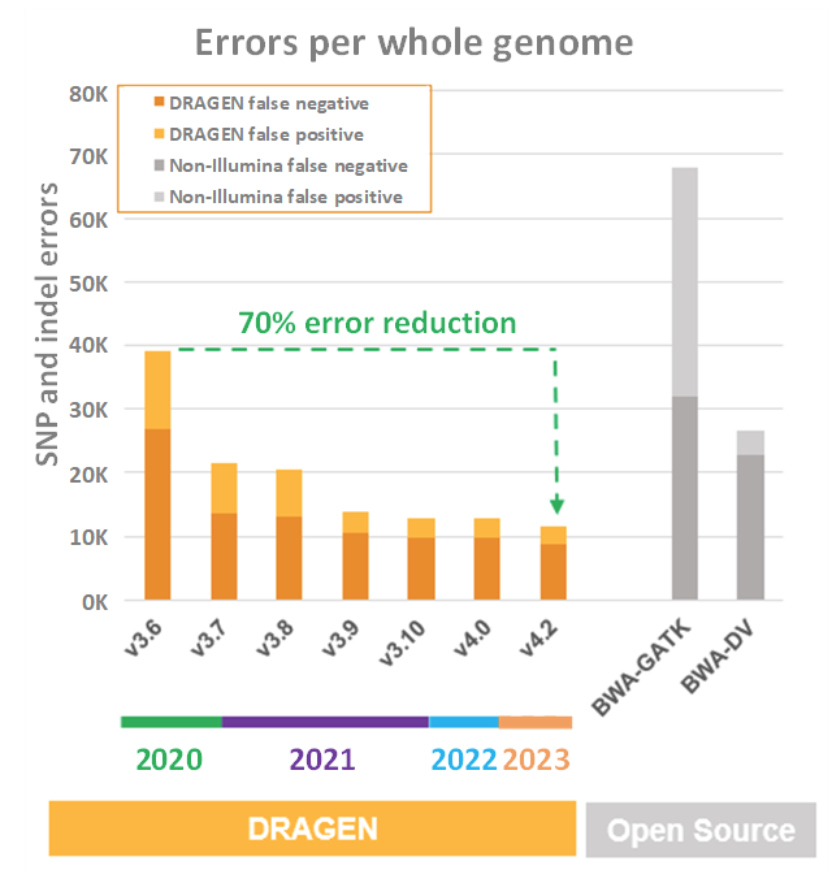
NovaSeq Xの装置上のDRAGENコンピューティングは、上記のすべてのスループット、コスト、電力、設置面積の比較において最も優れた結果を示しているのは、非常に印象的です。しかし、これらのチャートでは、DRAGENを加速するためにFPGAが選ばれた理由の全体像がよくわかりません。FPGAは、優れたスループット、コスト、パワー、および設置面積により、シーケンサーのリードからできるだけ多くの有用な情報を絞り出すタスクに、より計算処理集約的なアルゴリズムを適用できるため、DRAGENのアクセラレーションに選ばれました。DRAGENは、こうしたタスクを非常に得意とするようになり、旧世代との厳しい競争により、DRAGENパイプラインの一連のリリースごとに精度、感度、特異度を絶え間なく向上させています。これについて以下の図7にまとめ、サードパーティの二次解析パイプライン(BWA + GATKとGoogleのDeep Variant)と数世代にわたるDRAGENの両方について偽陽性と偽陰性のメトリクスを示しています。
結論
CPUメーカーとGPUメーカーはどちらも、ゲノムワークロードに関連する製品を改良し続けており、CPUまたはGPUのプログラミングパイプラインは、FPGAに必要になるものと比べ開発者の労力が少なくて済みます。
それにもかかわらず、イルミナのエンジニアは、ゲノムパイプラインをFPGAアクセラレーション対応プラットフォームに移植するという懸命な努力を行ってきました。このFPGAアクセラレーションは、お客様が気にかけているすべてのメトリクスにおいて、大きな利点を示し続けています。これは、FPGAアクセラレーション対応DRAGENパイプラインを使用できるイルミナのお客様にとって、真のメリットとなります。
ゲノミクス業界では、計算コスト、消費電力、またはターンアラウンドタイムの増大によって、現在目覚ましい進展を遂げているゲノミクスの進歩が突然減速または停止する可能性があるという、いわゆる「計算の壁」について多くの議論がなされています。FPGAアクセラレーションを使用すれば、このような障壁は視界から消えます。装置上のFPGAアクセラレーション対応DRAGENは、5分未満で30×カバレッジのヒトゲノムを完全に解析でき、計算コストは10セント未満で、必要エネルギーは最も効率的なTesla Model 3を500メートル走らせるのに必要な量とほぼ同じです。
DRAGENのスループット、コスト、パワー、フットプリントのメトリクスは、それだけでも素晴らしいものです。さらに驚くべきことに、DRAGENはこれらのメトリクスを達成しながら、同時に他のNGS二次解析パイプラインよりも優れた結果の品質(精度、感度、特異度)を絶えず向上させています。CPU、GPU、FPGAの進化に伴い、DRAGENチームは、ユーザーにより優れた、精度の高い結果を提供するため、最新テクノロジーの導入を積極的に追求しています。