Introduction
Antimicrobial resistance (AMR) is a leading global threat with significant impacts to human health and economic development.1,2 Understanding the emergence and spread of AMR at both the global and the local scale requires accurate, standardized AMR surveillance data. Global AMR surveillance efforts have increased in recent years. In 2022, 126 countries, territories, and states participated in the World Health Organization (WHO) Global Antimicrobial Resistance and Use Surveillance System (GLASS).2 However, much of the AMR data that has been collected to date is from individual samples in clinical settings, and is often limited to culturable, pathogenic species.3-6 The laboratory capacity required to conduct genomic AMR surveillance at the individual level is also high, which impedes efforts to track the spread of AMR.4-6
Monitoring AMR trends through genomic screening of environmental samples, such as wastewater, is an alternative approach to individual-based sampling that reduces the burden of sample collection on public health laboratories and provides community-level AMR frequency and abundance information through standardized analysis methods.5,6 Due to these advantages, next-generation sequencing (NGS)-based wastewater AMR surveillance is quickly gaining traction and may help unlock global AMR threat mitigation strategies.1 However, despite overcoming some challenges of individual-based sampling, samples collected from environmental sources still pose several challenges to NGS-based AMR detection methods.6 One such challenge is that AMR sequences represent a small fraction of the total DNA found in environmental samples.6
Shotgun metagenomic sequencing approaches are especially useful in applications prioritizing AMR marker discovery or applications requiring hypothesis-free microorganism detection. However, shotgun approaches for environmental AMR surveillance require sequencing at high depth and may not provide adequate sensitivity in complex matrices such as wastewater.7 Targeted NGS represents a differentiated, precise approach to environmental AMR surveillance.7 Targeted NGS via probe capture can yield significantly more reads from AMR targets, thereby delivering greater AMR marker detection sensitivity with reduced sequencing depth.7
The Urinary Pathogen ID/AMR Panel Enrichment Kit (UPIP, Illumina, For Research Use Only) was designed for broad and accurate detection of microbial and AMR sequences. Sequences relevant to human health may be detected at lower sequencing depth than with shotgun-based sampling approaches. UPIP targets 170+ genitourinary pathogens and 3700+ AMR markers, including 3600+ full AMR genes, comprising over 75% of AMR genes in the Comprehensive Antibiotic Resistance Database (CARD, version 3.2.5)8 and covering 75% of AMR threats on the Centers for Disease Control and Prevention (CDC)9 priority list and 83% on the WHO10 priority list (Table 1). The breadth of the UPIP AMR targets positions the panel as a prime candidate for NGS-based AMR surveillance in environmental samples. To examine the performance of UPIP enrichment in wastewater AMR surveillance, we sequenced wastewater samples with and without UPIP enrichment on the NovaSeq 6000 System, generating on average 300 million total reads per sample, and compared the AMR yield across different downsampled sequencing depths (Table 2).
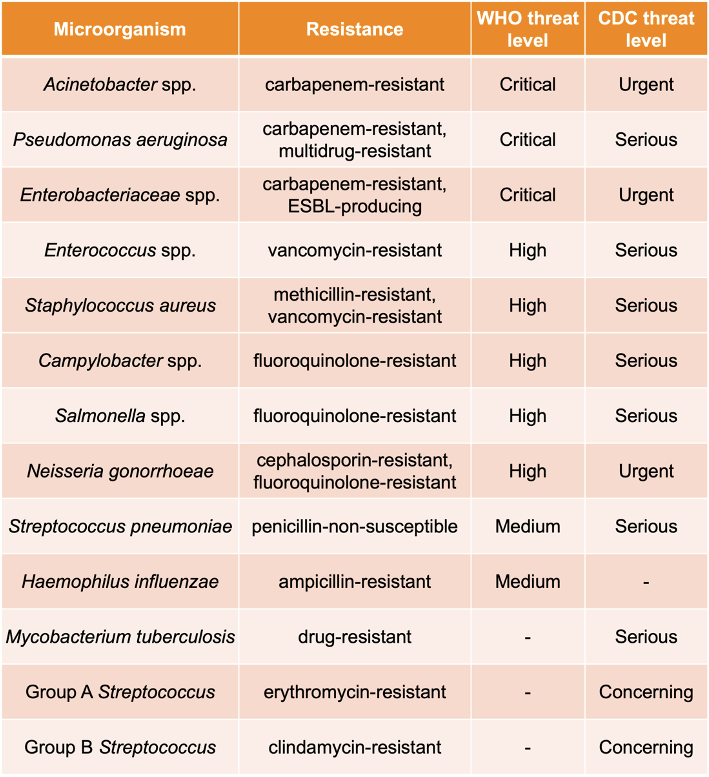
Table 1. CDC and WHO priority pathogens targeted by UPIP.
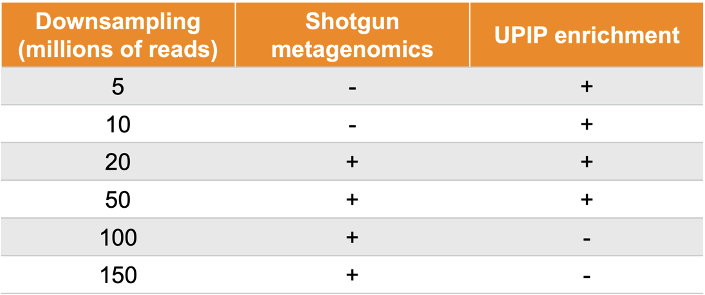
Table 2. Samples were sequenced to 300 million reads on average. UPIP enrichment samples were downsampled to 5 million, 10 million, 20 million, and 50 million reads. Shotgun samples were downsampled to 20 million, 50 million, 100 million, and 150 million reads.
UPIP enrichment significantly increases AMR yield: > 2500× more reads, > 3500× more read depth, > 3× more detections
AMR marker detection from short-read sequencing data requires high alignment coverage and percent identity between reads and AMR gene reference sequences, which depend on the yield of AMR reads derived from the sample as well as on analysis with a high-quality and comprehensive reference database and software solution. UPIP capture probes were designed to increase the sequencing yield from targeted AMR sequences, and the paired Explify UPIP Data Analysis app available in BaseSpace Sequence Hub (BSSH) was designed to produce consensus sequences and alignments with high coverage and high identity to enable accurate detection of AMR markers.
We estimated the proportion of sequencing reads originating from AMR sequences with and without UPIP enrichment using the sample composition feature of the Explify app (v1.0.0). Explify sample composition uses a kmer-based approach to classify reads to broad categories such as “human,” “bacterial,” or “AMR.” UPIP enrichment samples had a median of 50% of reads from CARD (version 3.2.5) AMR sequences compared to 0.02% of reads in shotgun samples. Even at 30× lower sequencing depth, the proportion of reads classified to AMR sequences was 2500-fold higher with UPIP enrichment (Figure 1). On average, UPIP enrichment samples had 2.4 million out of 5 million total reads classified to AMR sequences compared to 0.03 million out of 150 million total reads in shotgun samples. In conclusion, UPIP enrichment yielded significantly more reads classified to AMR sequences to support downstream detection algorithms.
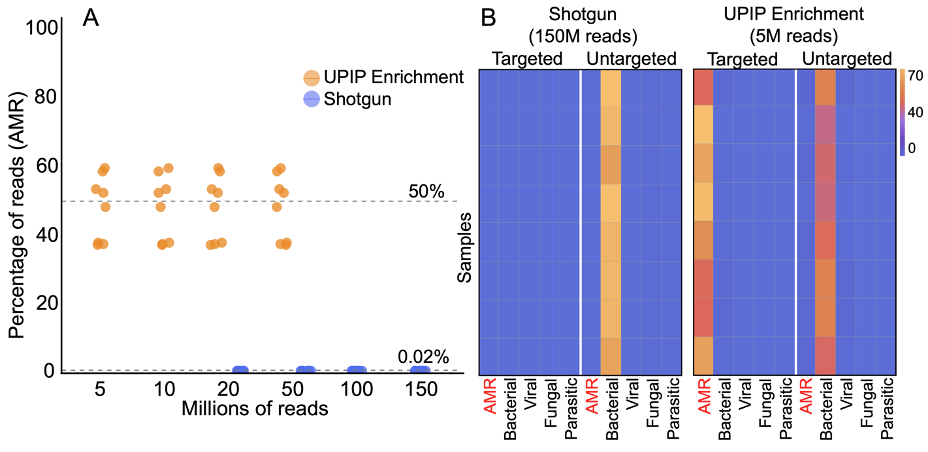
Figure 1A: Percentage of reads classified to AMR markers in UPIP enrichment samples versus shotgun samples. Dashed line indicates median percentage of reads.
Figure 1B: Sample composition using kmer-based read classification for UPIP enrichment samples (5 million total reads) versus shotgun samples (150 million total reads). Left panels show the percentage of total sample reads classified to sequences targeted by UPIP. Right panels show the percentage of total sample reads classified to sequences not targeted by UPIP. 75% of AMR genes in CARD (version 3.2.5) are targeted by UPIP.
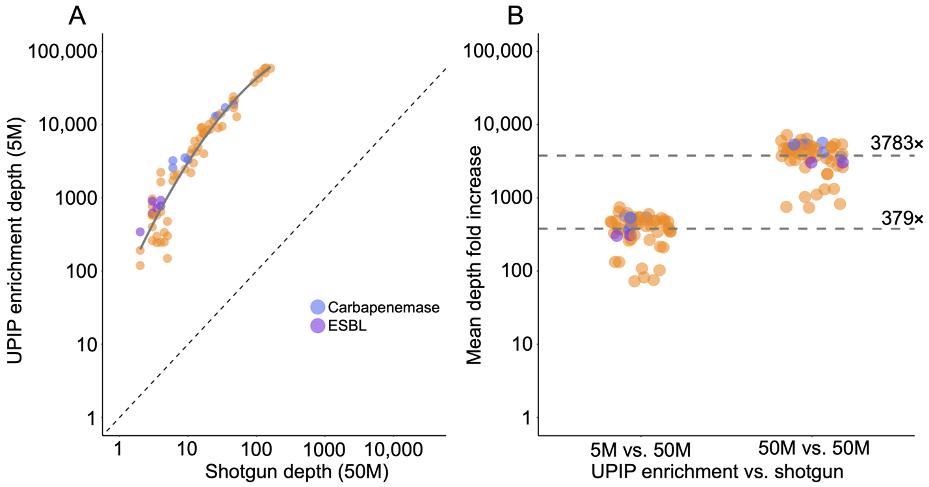
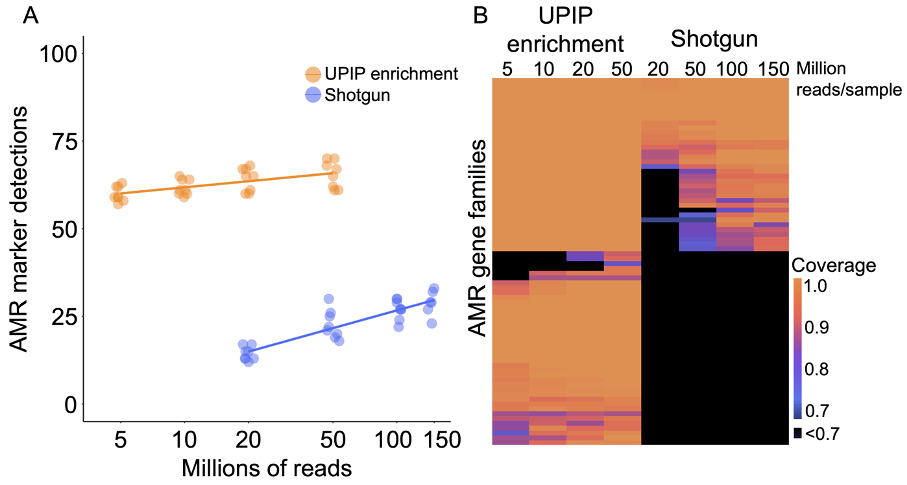
Figure 3A: AMR marker detections in UPIP enrichment versus shotgun samples.
Figure 3B: Alignment coverage as a proportion of sequence length in UPIP enrichment versus shotgun samples.
UPIP enrichment increases AMR variant calling power
Increased AMR sequencing yield is critical for accurate detection of low-abundance AMR markers and AMR marker variants. As such, we examined the effects of UPIP enrichment on AMR marker variant detection. The E448K mutation in the glpT gene was detected by the Explify app in all UPIP enrichment samples (5 million to 50 million reads).11 The same mutation was not detected in any of the shotgun samples with 20 million to 150 million downsampled reads but was detected in two of the eight original shotgun samples with more than 200 million reads. We observed an average depth of 85 reads per million total reads at this position in UPIP enrichment samples compared to 0.02 in shotgun samples, demonstrating that enrichment with UPIP increases the power to call variants associated with resistance in wastewater samples at a lower total sequencing depth (Figure 4).
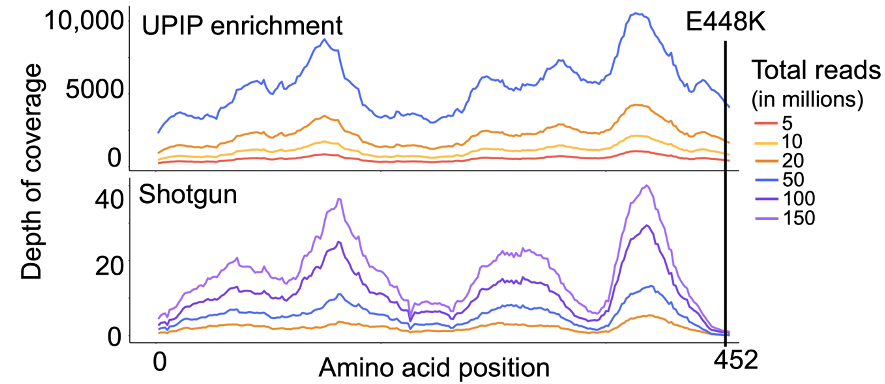
Figure 4. Mean depth of coverage across glpT in UPIP enrichment versus shotgun samples.
Detection of priority pathogens and potential AMR
Among the 170+ genitourinary pathogens targeted by UPIP, 12 pathogens on the CDC9 watchlist are reported (Table 1). We used the automated microorganism and AMR marker detection results from the Explify app to examine the co-detection of pathogens and associated AMR markers relevant to CDC priority threats. We found that six of the 12 pathogens targeted by UPIP were detected with potential AMR markers in at least one sample (Figure 5). Of these, all were detected in UPIP enrichment samples with at least 10 million total reads. Enterococcus species, Acinetobacter species, and Pseudomonas aeruginosa were detected in shotgun libraries, with the latter two detected only in libraries with at least 100 million reads. Potential AMR markers were detected at all sequencing depths in UPIP enrichment samples. Notably, AMR markers conferring resistance to vancomycin (for example, vanA, vanB, vanC, vanD, vanRA, vanHA, vanYA) and methicillin (for example, mecA, mecR1, mecI) were detected only in UPIP enrichment samples. For the scope of this analysis, a potential AMR marker is defined as a marker or combination of markers having known association with the given pathogen.
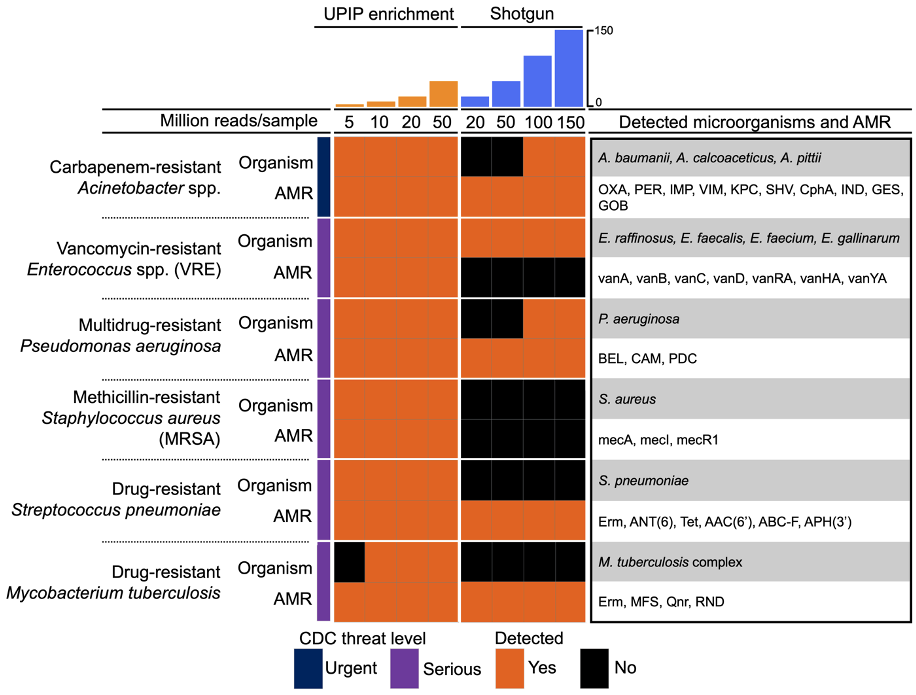
Figure 5. Co-detection of CDC priority pathogens and potential AMR markers.9 Orange fill indicates the detection of a pathogen or a potential AMR marker in at least one sample at the sequencing depth indicated in the column.
Conclusions
Wastewater samples enriched with UPIP probes generated > 2500× more reads from targeted AMR marker sequences, > 3500-fold higher read depth across targeted AMR marker sequences, > 3-fold more AMR marker detections per sample, and more robust co-detection of CDC-relevant priority pathogens with potential AMR markers. This significant increase in AMR yield supports broader and more accurate AMR marker detection, especially for low-abundance AMR markers and AMR marker variants, in complex sample types like wastewater at a fraction of the total sequencing cost of traditional shotgun metagenomics. This study affirms that precision metagenomics (PMG) is suitable for applications that prioritize both sensitivity and specificity, and that UPIP enrichment coupled with the Explify UPIP Data Analysis app provides an efficient analysis solution for environmental AMR surveillance insights.
How can I incorporate UPIP in my AMR surveillance workflow?
The UPIP Enrichment Kit supports up to 384 indexes, can be performed in under nine hours with up to two hours hands-on time, and is compatible with all Illumina instruments.12 The kit is available here: https://www.illumina.com/products/by-type/sequencing-kits/library-prep-kits/urinary-pathogen-id-amr-enrichment-kit.html
The Explify UPIP Data Analysis app is available through BaseSpace Sequence Hub and offers a dedicated cloud-based informatics solution for the UPIP Enrichment Kit with flexible analysis options, a user-friendly interface, and multiple convenient report formats. Additional information can be found here, including a free-to-download demo project: https://www.illumina.com/products/by-type/informatics-products/basespace-sequence-hub/apps/explify-upip-data-analysis.html
To read more about wastewater surveillance, click here: https://www.illumina.com/areas-of-interest/microbiology/public-health-surveillance/wastewater-surveillance.html
For questions, please contact the UPIP Technical Team at idbd_biofx_explify_support@illumina.com.
References:
1. Hendriksen RS, Munk P, Njage P, et al. Global monitoring of antimicrobial resistance based on metagenomics analyses of urban sewage. Nature Communications. 2019;10(1). doi: 10.1038/s41467-019-08853-3
2. Global antimicrobial resistance and use surveillance system (GLASS) report 2022. Geneva: World Health Organization; 2022. License: CC BY-NC-SA 3.0 IGO.
3. World Health Organization. Antimicrobial Resistance: Global Report on Surveillance. Geneva: World Health Organization; 2014.
4. Zignol M, Dean AS, et al. Twenty Years of Global Surveillance of Antituberculosis-Drug Resistance. N Engl J Med. 2016;375(1081-1089) doi:10.1056/NEJMsr1512438
5. Pruden A, Vikesland JP, Davis BC, et al. Seizing the moment: now is the time for integrated global surveillance of antimicrobial resistance in wastewater environments. Current Opinion in Microbiology. 2021;64. doi: 10.1016/j.mib.2021.09.013
6. Aarestrup FM, Woolhouse ME. Using sewage for surveillance of antimicrobial resistance. Science. 2020;367. doi:10.1126/science.aba3432
7. Guitor AK, Raphenya AR, et al. Capturing the Resistome: a targeted capture method to reveal antibiotic resistance determinants in metagenomes. Antimicrobial Agents and Chemotherapy. 2019;64. doi:10.1128/aac.01324-19
8. Alcock BP, Huynh W, Chalil R, et al. 2023. CARD 2023: expanded curation, support for machine learning, and resistome prediction at the Comprehensive Antibiotic Resistance Database. Nucleic Acids Research, 51, D690-D699.
9. CDC. Antibiotic Resistance Threats in the United States, 2019. Atlanta, GA: U.S. Department of Health and Human Services, CDC; 2019.
10. Prioritization of pathogens to guide discovery, research and development of new antibiotics for drug-resistant bacterial infections, including tuberculosis. Geneva: World Health Organization; 2017(WHO/EMP/IAU/2017.12). Licence: CC BY-NC-SA 3.0 IGO.
11. Takahata S, Ida T, Hiraishi T, Sakakibara S, Maebashi K, Terada S, Muratani T, Matsumoto T, Nakahama C, Tomono K. Molecular mechanisms of fosfomycin resistance in clinical isolates of Escherichia coli. Int J Antimicrob Agents. 2010 Apr;35(4):333-7. doi: 10.1016/j.ijantimicag.2009.11.011. Epub 2010 Jan 13. PMID: 20071153.